Find the answer to your IoT questions
This article explains how to follow a SIM’s data usage history in histogram version in our SIM Management Platform’s.
The graph view is the most user-friendly way to display and understand usage.
Here’s a little use case. Here is the data usage of my SIM over the past months:
By hovering my cursor over the bars, the cumulated usage is displayed. I notice that this SIM has had an increased usage in December: 10GB
By toggling to daily view, I notice a high peak of usage happened on December 18th:
To go further, I’ll filter down on that very day, and toggle the view to hourly:
I can now see that out of the 10GB usage made on that day, 9.26GB were used just in a one-hour period! That’s good intel to start an investigation!
So let’s review the commands used: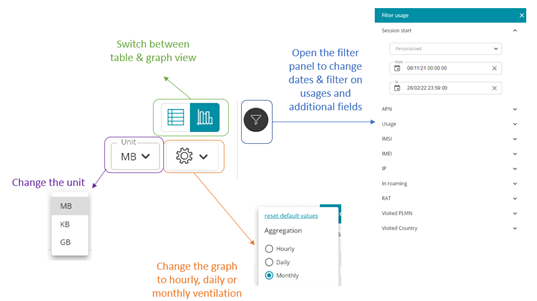
To find out more about the fields available to filter data, check out this article.
To learn about the table view of a SIM’s usage history, see this article.
Can’t find your answer?